Your cart is currently empty!
How To Create A Sales Forecast Dashboard With Google Sheets Using Python
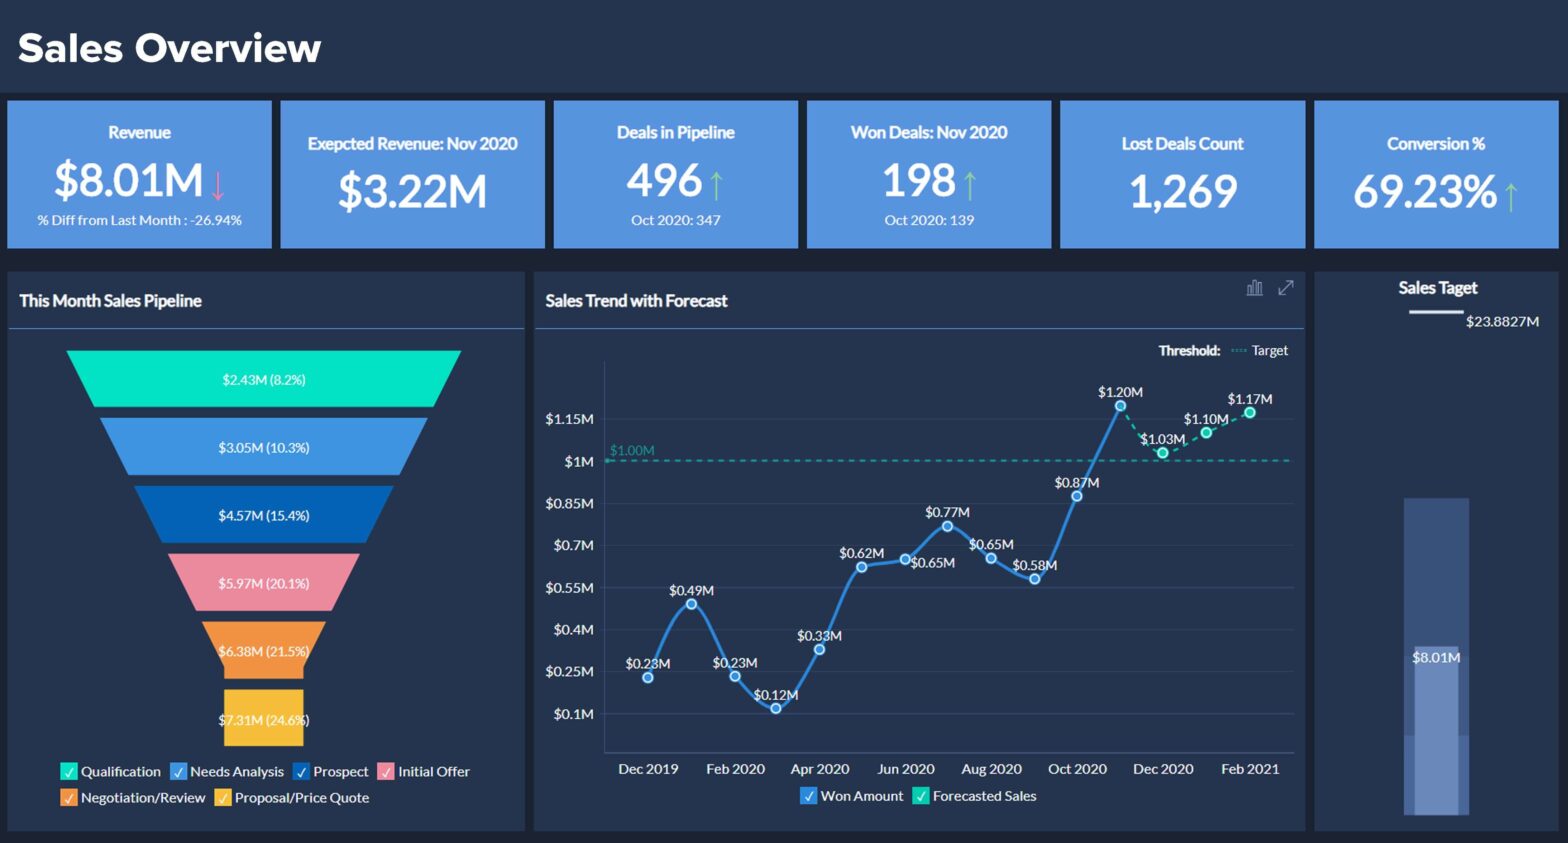
Sales forecasting is crucial for businesses to anticipate revenues and manage resources effectively. Combining the versatility of Google Sheets with Python’s powerful libraries, you can create a dynamic sales forecast dashboard.
1. Setting Up Google Sheets API1:
Before you can interact with Google Sheets using Python, you need to set up the Google Sheets API and obtain the necessary credentials.- Go to the Google Developers Console: https://console.developers.google.com/
- Create a new project.
- Enable the Google Sheets API for that project.
- Create credentials (OAuth 2.0 Client IDs) for a Desktop App.
- Download the credentials.json file.
2. Install Required Python Libraries:
You’ll need to install a few libraries to interact with Google Sheets:
pip install –upgrade google-api-python-client google-auth-httplib2 google-auth-oauthlib gspread pandas
3. Authenticating and Accessing Google Sheets:
Here’s a simple Python code that authenticates and accesses Google Sheets: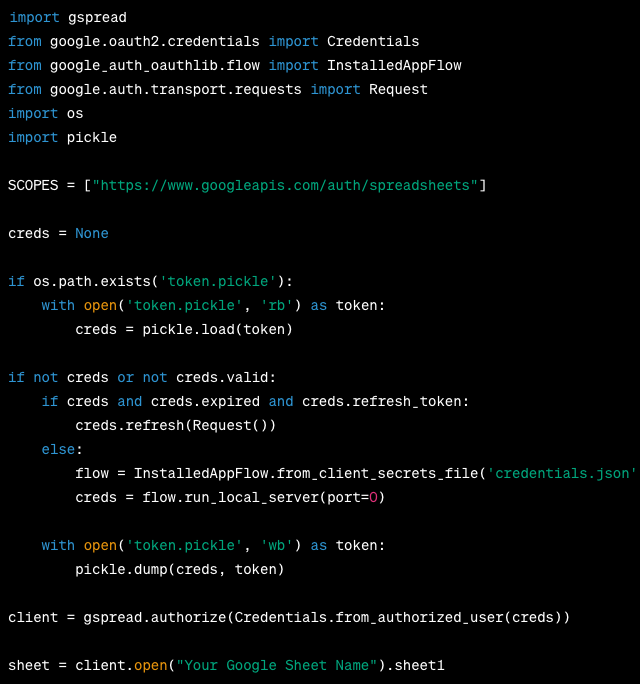
Replace “Your Google Sheet Name” with the name of your Google Sheet.
4. Inserting/Reading Data:
Once you’ve accessed your sheet, you can insert or read data:# Inserting datasheet.append_row([“Date”, “Sales”, “Forecast”])# Reading data values = sheet.get_all_values() print(values)5. Creating a Sales Forecast Dashboard:
- Structure your Google Sheet with columns like “Date”, “Actual Sales”, “Forecasted Sales”, etc.
- Use the Python code above to populate the sheet with sales data and forecasts. You can use libraries like pandas and statsmodels for forecasting.
- In Google Sheets, you can use its built-in charting tools to create visualizations like line charts to show actual vs. forecasted sales.
6. Regularly Update the Dashboard:
You can set up a cron job or a scheduled task to run your Python script at regular intervals to update the data and forecasts in the dashboard.
Remember, this is a basic guide. Depending on your needs, you might want to add more features, like error handling, data validation, and more sophisticated forecasting models.
Conclusion:
In the digital age, manual sales forecasting is both cumbersome and prone to errors. By leveraging the automation capabilities of Python and the user-friendly interface of Google Sheets, businesses can create a dynamic, accurate, and visually appealing sales forecast dashboard. Regular updates ensure it remains a reliable tool for decision-making. As businesses grow and evolve, this dashboard can be easily scaled and modified to suit changing needs, making it a long-term asset for any enterprise.
Leave a Reply